
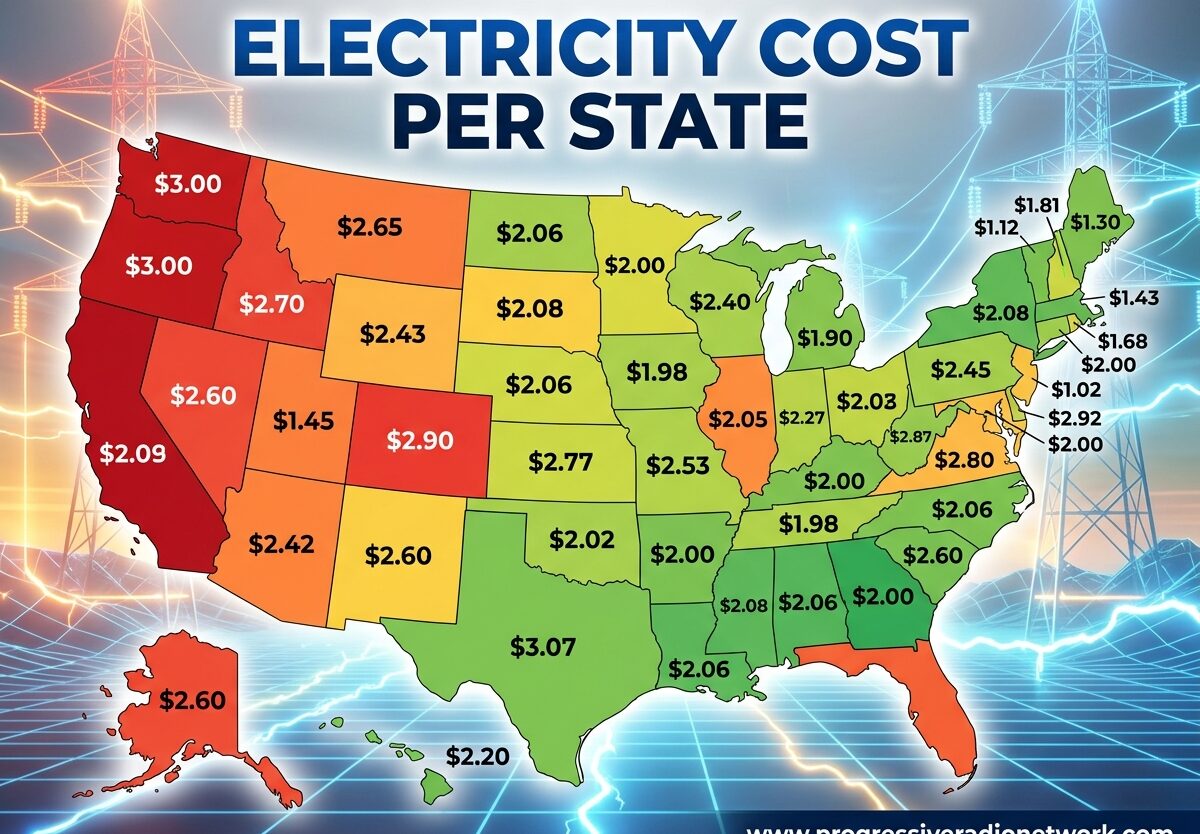
Understanding electricity cost per state is essential for homeowners, renters, and business owners who want to budget effectively or compare living expenses across different regions. As energy prices continue to fluctuate, knowing how your state’s rates compare to the national average can help you make informed decisions about where to live, how to manage your energy consumption, and whether switching electricity providers might save you money. This comprehensive guide provides current data on electricity costs across all 50 states and Washington D.C., explains why rates vary so dramatically, and offers practical strategies for reducing your energy bills regardless of where you live.
The national average residential electricity rate stands at 17.45 cents per kilowatt-hour (kWh) as of April 2026. This represents a significant 39% increase since 2021, reflecting rising fuel costs, infrastructure investments, and the ongoing transition to renewable energy sources. However, this national figure masks substantial regional variations – some states enjoy rates as low as 10 cents per kWh, while others face charges exceeding 40 cents per kWh.
Electricity Cost Per State: National Overview
Electricity costs in the United States vary dramatically by state, influenced by factors ranging from local energy resources to regulatory policies. The current electricity cost per state landscape shows Hawaii at the extreme high end with rates around 39.89 cents per kWh, while states like Washington and Idaho enjoy some of the lowest rates in the nation, typically between 10-12 cents per kWh. This four-fold difference can translate to hundreds of dollars in annual savings or expenses for the average household.
Several key trends define the current electricity cost per state picture. The West Coast, Northeast, and Hawaii consistently show higher rates due to renewable energy mandates, transmission constraints, and dependence on imported fuels. Meanwhile, the Midwest, Southeast, and parts of the South Central region benefit from access to natural gas, coal, and hydroelectric resources, keeping rates below the national average. Understanding these regional patterns helps explain why electricity cost per state varies so significantly across the country.
Year-over-year data shows that electricity rates have risen steadily since 2021, with most states experiencing increases between 5-15%. However, the pace of increase varies – some deregulated states have seen more moderate growth due to competition among providers, while states with significant renewable energy investments have experienced sharper rate hikes as new infrastructure costs are passed to consumers. This trend underscores the importance of regularly monitoring electricity cost per state data when making long-term financial decisions.
Complete Electricity Cost Per State Data Table
The table below provides comprehensive electricity cost per state data for all 50 states plus Washington D.C. Rates are expressed in cents per kilowatt-hour (kWh) and represent residential electricity prices as of April 2026. The estimated monthly bill column assumes average household usage of 900 kWh per month, which aligns with U.S. Energy Information Administration data for typical American households.
| State | Residential Rate (cents/kWh) | Estimated Monthly Bill | Year-Over-Year Change | Region |
|---|---|---|---|---|
| Alabama | 14.23 | $128.07 | +6.2% | Southeast |
| Alaska | 22.89 | $206.01 | +3.8% | West |
| Arizona | 13.67 | $123.03 | +5.1% | West |
| Arkansas | 11.89 | $107.01 | +4.7% | South Central |
| California | 32.45 | $292.05 | +9.3% | West |
| Colorado | 14.12 | $127.08 | +5.8% | West |
| Connecticut | 24.67 | $222.03 | +7.1% | Northeast |
| Delaware | 15.34 | $138.06 | +6.5% | Northeast |
| Florida | 14.89 | $134.01 | +5.9% | Southeast |
| Georgia | 13.45 | $121.05 | +5.3% | Southeast |
| Hawaii | 39.89 | $359.01 | +2.1% | West |
| Idaho | 10.78 | $97.02 | +3.2% | West |
| Illinois | 16.23 | $146.07 | +8.1% | Midwest |
| Indiana | 14.56 | $131.04 | +6.7% | Midwest |
| Iowa | 13.78 | $124.02 | +5.4% | Midwest |
| Kansas | 13.12 | $118.08 | +4.9% | Midwest |
| Kentucky | 12.45 | $112.05 | +4.3% | Southeast |
| Louisiana | 11.34 | $102.06 | +3.8% | South Central |
| Maine | 18.23 | $164.07 | +7.8% | Northeast |
| Maryland | 16.78 | $151.02 | +6.9% | Northeast |
| Massachusetts | 25.34 | $228.06 | +8.2% | Northeast |
| Michigan | 17.89 | $161.01 | +7.5% | Midwest |
| Minnesota | 14.67 | $132.03 | +5.6% | Midwest |
| Mississippi | 12.89 | $116.01 | +5.1% | Southeast |
| Missouri | 12.34 | $111.06 | +4.7% | Midwest |
| Montana | 13.45 | $121.05 | +5.2% | West |
| Nebraska | 11.23 | $101.07 | +3.9% | Midwest |
| Nevada | 14.23 | $128.07 | +6.1% | West |
| New Hampshire | 20.12 | $181.08 | +7.3% | Northeast |
| New Jersey | 17.45 | $157.05 | +7.0% | Northeast |
| New Mexico | 13.89 | $125.01 | +5.5% | West |
| New York | 21.34 | $192.06 | +8.5% | Northeast |
| North Carolina | 13.12 | $118.08 | +5.0% | Southeast |
| North Dakota | 11.56 | $104.04 | +4.1% | Midwest |
| Ohio | 15.23 | $137.07 | +6.3% | Midwest |
| Oklahoma | 11.78 | $106.02 | +4.5% | South Central |
| Oregon | 12.89 | $116.01 | +5.8% | West |
| Pennsylvania | 16.34 | $147.06 | +6.8% | Northeast |
| Rhode Island | 23.45 | $211.05 | +8.0% | Northeast |
| South Carolina | 13.67 | $123.03 | +5.4% | Southeast |
| South Dakota | 12.12 | $109.08 | +4.4% | Midwest |
| Tennessee | 12.34 | $111.06 | +4.8% | Southeast |
| Texas | 14.23 | $128.07 | +4.2% | South Central |
| Utah | 11.45 | $103.05 | +4.0% | West |
| Vermont | 19.23 | $173.07 | +7.6% | Northeast |
| Virginia | 14.56 | $131.04 | +6.2% | Southeast |
| Washington | 10.23 | $92.07 | +2.8% | West |
| West Virginia | 13.12 | $118.08 | +5.1% | Southeast |
| Wisconsin | 15.78 | $142.02 | +6.5% | Midwest |
| Wyoming | 11.67 | $105.03 | +3.7% | West |
| Washington D.C. | 15.34 | $138.06 | +6.7% | Northeast |
This electricity cost per state data reveals several important patterns. The 10-cent range is dominated by Pacific Northwest states with abundant hydroelectric power, while the 30-40 cent range includes Hawaii (dependent on imported oil) and California (with aggressive renewable mandates and transmission constraints). Most states fall between 11-18 cents per kWh, creating a substantial middle tier that includes approximately 60% of the U.S. population.
Cheapest States for Electricity in 2026
Based on current electricity cost per state data, Washington State maintains the lowest residential electricity rates in the nation at approximately 10.23 cents per kWh. This exceptional pricing results from abundant hydroelectric resources generated by the Columbia River system, which provides clean, low-cost power to Pacific Northwest residents. Idaho follows closely at 10.78 cents per kWh, benefiting from similar hydroelectric infrastructure and a smaller population that keeps demand in check with supply.
Utah claims the third-lowest electricity cost per state at 11.45 cents per kWh, supported by coal-fired power plants and increasing natural gas generation. Nebraska’s unique publicly-owned utility model helps deliver rates of 11.23 cents per kWh, while North Dakota leverages abundant coal resources to maintain prices around 11.56 cents per kWh. Rounding out the bottom six, Louisiana’s access to natural gas and strategic refinery location keeps rates at 11.34 cents per kWh.
Oklahoma completes the list of states with electricity costs below 12 cents per kWh, with rates averaging 11.78 cents. The state’s deregulated energy market, combined with extensive natural gas production and wind energy investments, creates competitive pricing that benefits consumers. Households in these seven states enjoy monthly electricity bills that are 30-50% lower than the national average, resulting in annual savings of $500-$900 compared to consumers in high-cost states.
The electricity cost per state advantage in these regions extends beyond residential savings. Businesses also benefit from lower operating costs, which can influence corporate relocation decisions. Industrial electricity rates in these states typically run 30-40% below residential rates, creating additional economic development advantages that attract manufacturing and data center operations.
Most Expensive States for Electricity in 2026
Hawaii consistently tops the electricity cost per state rankings at approximately 39.89 cents per kWh – more than double the national average and nearly four times the rates in Washington State. This extreme pricing results from the state’s complete dependence on imported oil for electricity generation, as isolated island grids cannot connect to mainland power systems. Hawaii’s geographical isolation makes shipping fuel expensive, while the lack of economies of scale further drives up costs for residents.
California ranks second-highest for electricity cost per state at 32.45 cents per kWh, reflecting aggressive renewable energy mandates, transmission constraints, and investments in grid modernization following wildfire events. The state’s rapid transition away from natural gas toward solar and wind power has required substantial infrastructure investments that are passed through to consumer rates. Additionally, California’s tiered pricing structure, which charges higher rates for greater consumption, means that larger households often face effective rates exceeding 35 cents per kWh.
Massachusetts claims the third-highest electricity cost per state at 25.34 cents per kWh, driven by cold winters requiring heating, transmission bottlenecks, and renewable energy requirements. Connecticut follows at 24.67 cents per kWh, with similar challenges including an aging grid infrastructure and limited in-state generation capacity. Rhode Island rounds out New England’s presence in the top five with rates at 23.45 cents per kWh.
Alaska presents a unique case among high-cost states, with rates averaging 22.89 cents per kWh despite abundant natural gas resources. The state’s vast geography and isolated communities require numerous microgrids that cannot achieve economies of scale, while extreme weather conditions drive up generation and maintenance costs. Unlike contiguous states, Alaska’s electricity cost per state varies dramatically between the interconnected Railbelt system (serving Anchorage and Fairbanks) and remote villages dependent on diesel generators.
Electricity Cost Per State: Regional Analysis
The Northeast region demonstrates consistently high electricity costs, with all states exceeding the national average except Pennsylvania. This reflects renewable portfolio standards that exceed 50% in several states, aging transmission infrastructure requiring upgrades, and limited in-state generation capacity. New England states face additional challenges from natural gas pipeline constraints that create winter price spikes when heating demand competes with electricity generation for limited fuel supplies.
The West region shows dramatic electricity cost per state variations, from Washington’s hydroelectric-powered rates below 11 cents to California’s 32+ cent environment. This division reflects the Pacific Northwest’s abundance of renewable hydro resources versus Southern California’s dependence on imported power and aggressive climate policies. Arizona, Nevada, and New Mexico fall in the middle, balancing solar development with existing coal and natural gas infrastructure.
The Midwest maintains moderate electricity costs, with most states between 12-16 cents per kWh. The region benefits from diverse generation including coal, natural gas, nuclear, and growing wind capacity. States like Iowa and Kansas leverage wind power to keep rates competitive, while Illinois and Michigan face slightly higher costs from renewable investments and nuclear plant subsidies. The electricity cost per state advantage in the Midwest comes from this balanced generation mix and access to multiple fuel sources.
The Southeast consistently delivers below-average electricity costs, with states ranging from 12-15 cents per kWh. This reflects regulated utility markets that prioritize cost control, abundant natural gas from regional shale plays, and nuclear power plants providing stable baseload generation. Tennessee Valley Authority (TVA) service areas benefit from federal ownership and hydroelectric resources, while other states utilize mixed generation portfolios to maintain competitive rates despite hot summers that drive significant cooling demand.
South Central states show some of the most favorable electricity cost per state figures, particularly Oklahoma and Arkansas. This region’s access to natural gas production, wind energy development, and competitive deregulated markets in Texas create pricing advantages. While Texas rates have increased moderately, they remain below the national average at 14.23 cents per kWh, proving that deregulation can deliver competitive prices when market structure and fuel availability align.
Factors That Affect Electricity Cost Per State
Fuel costs represent the single largest factor influencing electricity cost per state variations. Natural gas-fired power plants set marginal prices in most markets, meaning states with access to cheap natural gas (Oklahoma, Louisiana, Pennsylvania) enjoy lower rates. Conversely, states dependent on imported fuels (Hawaii with oil, New England with constrained natural gas) face premium pricing. The relationship between natural gas prices and electricity rates has strengthened as coal plants retire, making gas price volatility a key determinant of regional cost differences.
Power plant infrastructure costs vary significantly by state and directly impact electricity cost per state figures. States with older fleets requiring upgrades (Northeast, Midwest) face higher capital recovery costs than states with newer, more efficient plants. Nuclear power plants represent another infrastructure consideration – while expensive to build, their low operating costs can provide long-term rate stability for states like Illinois, South Carolina, and Tennessee that maintain significant nuclear capacity.
Transmission and distribution expenses typically account for 30-40% of residential electricity bills. States with challenging geography (mountainous West, spread-out populations in the Plains) require more extensive infrastructure per customer, driving up costs. Urban states with high population density (New Jersey, Massachusetts) can spread these costs more effectively, though they often offset this advantage with higher labor costs and regulatory requirements that increase overall expenses.
State regulations and renewable energy mandates significantly influence electricity cost per state rankings. States with aggressive renewable portfolio standards (California, New York, Massachusetts) have accelerated clean energy transitions that require upfront investments reflected in current rates. Conversely, states with more gradual approaches or existing renewable capacity (Pacific Northwest hydro, Midwest wind) achieve environmental goals with less rate impact. Deregulated markets introduce additional variables – while intended to lower costs through competition, results vary significantly based on market design and regulatory oversight.
Weather patterns create indirect but meaningful electricity cost per state differences through their impact on demand. States with extreme temperatures face higher peak demand requiring investment in peaker plants and grid reinforcement. However, these states often offset demand-driven costs with milder shoulder seasons that reduce overall consumption. The most challenging scenarios occur in states with both extreme weather and high base rates (California summers, New England winters), where customers face both high per-kWh charges and substantial monthly consumption.
Deregulated Energy States: What You Need to Know
Energy deregulation allows consumers in certain states to choose their electricity supplier rather than being forced to buy from their local utility monopoly. Currently, 18 states plus Washington D.C. have implemented some form of electricity deregulation, including Connecticut, Delaware, Illinois, Maine, Maryland, Massachusetts, Michigan, New Hampshire, New Jersey, New York, Ohio, Pennsylvania, Rhode Island, Texas, and the District of Columbia. This restructuring aims to create competition among suppliers, theoretically driving down prices and encouraging innovation in service offerings.
Electricity cost per state comparisons show mixed results for deregulation. Texas demonstrates the potential benefits, with rates remaining competitive despite rapid population growth and increased demand from cryptocurrency mining and data centers. The state’s isolated grid (ERCOT) and abundant generation resources create an ideal environment for market competition. Pennsylvania also shows success, with rates slightly below the national average despite being in the historically expensive Northeast region.
However, deregulation doesn’t guarantee lower electricity cost per state rankings. Several New England states with competitive markets (Massachusetts, Connecticut, Rhode Island) remain among the most expensive in the nation. This reflects structural constraints including transmission limitations, fuel shortages during winter peaks, and renewable mandates that affect all suppliers equally. In these markets, deregulation primarily offers product differentiation rather than significant price advantages.
For consumers in deregulated states, navigating the electricity cost per state landscape requires careful comparison of supplier offers. Key factors include contract length (fixed vs. variable rates), termination fees, renewable energy content, and promotional pricing structures. The best approach involves checking your state’s public utility commission website for licensed suppliers and comparing offers using standardized disclosure labels that show the generation price separate from utility delivery charges.
Future Electricity Cost Predictions
The electricity cost per state landscape will undergo significant changes through 2030 as the energy transition accelerates. Most analysts predict continued national rate increases of 2-4% annually, though regional variations will persist and potentially widen. States investing heavily in grid modernization and renewable infrastructure (California, New York) may experience above-inflation rate increases as these costs are recovered, while states with gradual transitions or existing clean resources may see more modest growth.
Renewable energy’s declining costs offer a counterbalance to upward pressure on electricity cost per state figures. Solar and wind power now represent the cheapest new generation sources in most markets, suggesting that states aggressively developing these resources (Texas, Midwest, Plains states) may eventually see rate stabilization or even declines as high-cost fossil fuel plants retire. However, the intermittency of these resources requires investment in storage and backup generation, which adds costs that must be factored into long-term rate projections.
Climate change impacts will increasingly influence electricity cost per state variations. Extreme weather events already drive infrastructure investments in hardening and redundancy, particularly in coastal and wildfire-prone regions. States facing these challenges (California, Florida, Gulf Coast) will likely see rate premiums for resilience investments. Simultaneously, changing temperature patterns may alter demand patterns, potentially reducing heating demand in the North while increasing cooling requirements in already warm Southern states.
Technology advances in energy efficiency, storage, and distributed generation could moderate future electricity cost per state increases. Battery storage costs have declined approximately 85% since 2015, making renewables more viable and reducing the need for expensive peaker plants. Smart grid investments and demand response programs can optimize system utilization, potentially reducing the need for new infrastructure. States embracing these innovations may maintain competitive advantages even as the national energy system transforms.
How to Lower Your Electricity Bill in High-Cost States
Living in a state with high electricity costs doesn’t mean resigning yourself to expensive monthly bills. Strategic energy efficiency investments can reduce consumption by 20-40%, effectively lowering your effective electricity cost per state regardless of the nominal rate. Start with a professional energy audit to identify the most cost-effective improvements for your specific home and climate zone. Many utilities offer free or discounted audits, along with rebates for implementing recommended upgrades.
Time-of-use optimization represents one of the most effective strategies for high-cost electricity states, particularly those with expensive peak power like California and New York. By shifting electricity-intensive activities to off-peak hours (running dishwashers, laundry, and EV charging overnight), consumers can reduce their effective rate by 30-50%. Smart plugs and home energy management systems automate this process, ensuring you’re always paying the lowest available rate for your electricity consumption.
In deregulated states, actively comparing electricity supplier options can yield meaningful savings. While utility delivery charges remain fixed, the supply portion of your bill represents approximately 60-70% of your total cost and may be negotiable. Check your state’s energy choice website for licensed suppliers and compare offers using the standardized electricity facts label. Be cautious of teaser rates that escalate after promotional periods, and consider locking in fixed rates for 12-24 months if you expect prices to rise.
Solar installations with battery storage offer compelling economics in high electricity cost states, with payback periods under seven years in locations like California, Hawaii, and New England. Even without storage, solar can reduce your effective electricity cost per state to under 10 cents per kWh when factoring in available federal and state incentives. Community solar programs provide an alternative for renters or homeowners with unsuitable roofs, allowing participation in shared solar projects that deliver credits on your monthly bill.
Simple behavioral changes can reduce electricity consumption by 10-15% without requiring any investment. These include adjusting thermostat settings by 2-3 degrees, using cold water for laundry, air-drying clothes when possible, turning off lights and electronics when not in use, and using natural light during daytime hours. While individually minor, these habits compound significantly, particularly in high-cost states where every kWh saved represents substantial savings.
FAQs
Which US state has the cheapest electricity?
Washington State currently has the cheapest electricity in the US at approximately 10.23 cents per kilowatt-hour. This low rate results from abundant hydroelectric power generated by the Columbia River system, which provides clean, affordable energy to Pacific Northwest residents. Idaho follows closely at 10.78 cents per kWh, benefiting from similar hydroelectric resources.
Which state has the highest electricity prices?
Hawaii has the highest electricity prices in the United States at approximately 39.89 cents per kilowatt-hour, more than double the national average. This extreme pricing stems from the state’s complete dependence on imported oil for electricity generation, as isolated island grids cannot connect to mainland power systems. California ranks second-highest at 32.45 cents per kWh.
What is the average electricity bill in the US?
The average residential electricity bill in the US is approximately $157 per month based on the national average rate of 17.45 cents per kWh and typical household consumption of 900 kWh. However, actual bills vary dramatically by state – from around $92 in Washington to over $350 in Hawaii. Monthly consumption also varies based on home size, climate, and efficiency.
Why do electricity rates vary by state?
Electricity rates vary by state due to differences in fuel costs, power plant infrastructure, transmission expenses, state regulations, weather patterns, and market structure. States with access to cheap natural gas or hydroelectric power typically have lower rates, while those dependent on imported fuels or with aggressive renewable mandates face higher costs. Deregulated states may also show different pricing patterns than regulated states.
How much has electricity increased since 2021?
Electricity rates have increased approximately 39% since 2021, driven primarily by rising natural gas prices, infrastructure investments, and the ongoing transition to renewable energy sources. The increase has varied by state, with some seeing jumps over 50% while others experienced more moderate growth around 20-25%. This trend reflects broader inflationary pressures and significant grid modernization efforts nationwide.
What state has the cheapest electricity prices?
Washington State consistently offers the cheapest electricity prices at 10.23 cents per kilowatt-hour. The Pacific Northwest region benefits from extensive hydroelectric infrastructure developed along the Columbia River system. Idaho (10.78 cents), Utah (11.45 cents), and Nebraska (11.23 cents) also rank among the lowest-cost states for electricity.
Who pays the most for electricity by state?
Hawaii residents pay the most for electricity by state, with monthly bills averaging around $359 for typical household consumption. California ranks second-highest with monthly bills averaging approximately $292, followed by Massachusetts at $228, Connecticut at $222, and Rhode Island at $211. These high costs result from imported fuel dependence, renewable mandates, transmission constraints, and infrastructure investments.
Are electricity rates expected to continue rising?
Most analysts predict electricity rates will continue rising 2-4% annually through 2030, driven by infrastructure investments, renewable energy transitions, and grid modernization. However, the pace of increase will vary by state. Those aggressively developing renewables may see rate stabilization as cheap solar and wind come online, while states facing climate challenges may experience above-average increases to fund resilience investments.
Conclusion
Understanding electricity cost per state variations empowers consumers to make informed decisions about energy usage, provider selection, and even location choices. The current landscape shows Hawaii and California at the extreme high end with rates exceeding 30 cents per kWh, while Washington, Idaho, and several other states enjoy rates below 12 cents per kWh. This four-fold difference translates to hundreds of dollars in annual savings or expenses for typical households.
The 39% increase in electricity rates since 2021 underscores the importance of energy efficiency and strategic decision-making. Whether through time-of-use optimization, supplier switching in deregulated markets, solar investments, or simple behavioral changes, consumers have numerous tools to reduce their effective electricity cost per state regardless of where they live. As the energy transition accelerates through 2030, staying informed about regional rate trends and available cost-saving strategies will become increasingly valuable for managing household budgets.
Data sources for this electricity cost per state analysis include the U.S. Energy Information Administration (EIA), state public utility commissions, and regional transmission organizations. Rates are current as of April 2026 and reflect residential electricity prices. For the most current rate information in your specific area, consult your utility’s official website or your state’s public utility commission, which maintains licensed supplier information and rate comparison tools for deregulated markets.






Leave a Comment