
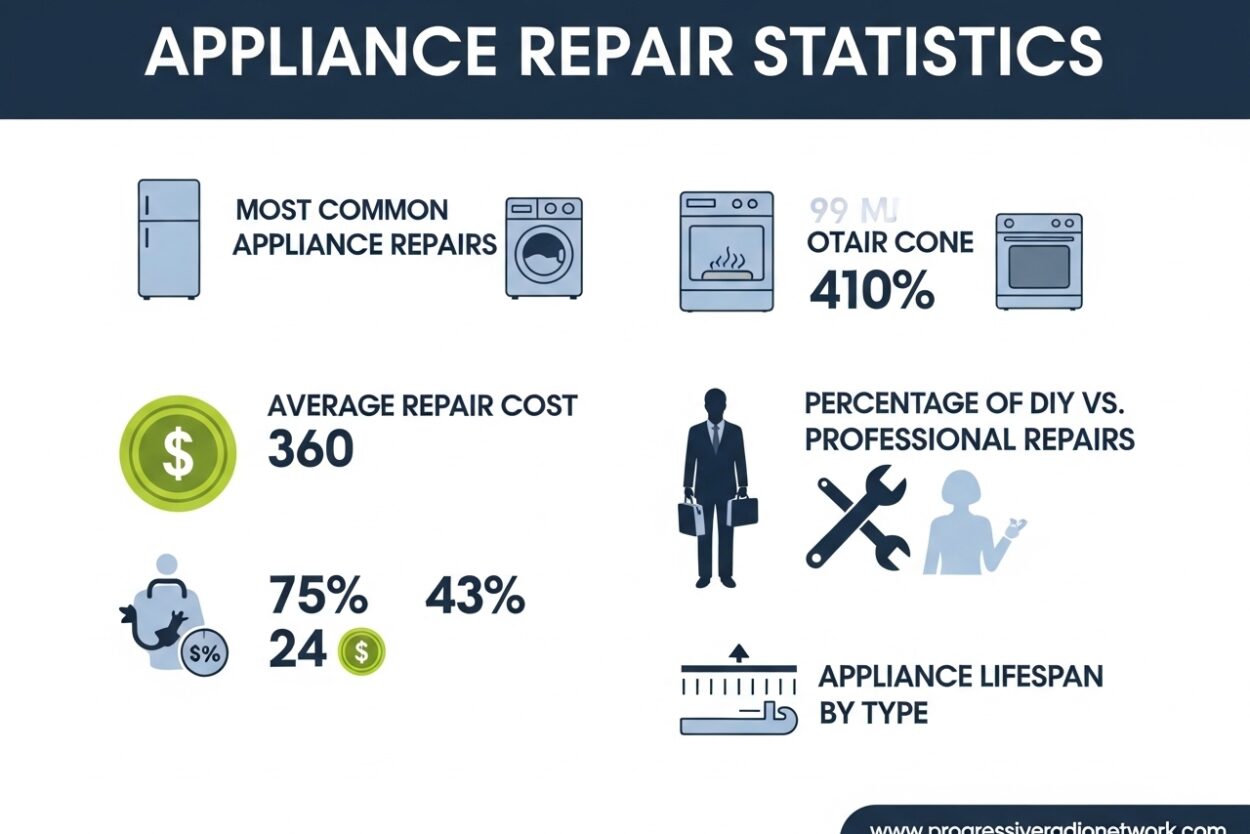
Understanding appliance repair statistics helps homeowners make smarter decisions about maintaining, fixing, or replacing household essentials. The appliance repair industry generates approximately $6.5 billion annually in the United States alone, supporting over 37,769 specialized businesses that keep our homes running smoothly. Whether you’re facing a broken refrigerator or weighing repair costs against replacement prices, having access to current appliance repair statistics empowers you to make financially sound choices for your home appliances.
This comprehensive guide covers the latest industry data, average repair costs by appliance type, common failure points, and employment statistics that shape the repair landscape. I’ve compiled data from industry reports, government statistics, and real-world service records to give you accurate, actionable information for your repair decisions.
Appliance Repair Industry Overview
The appliance repair industry represents a significant segment of the home services sector, generating an estimated $6.5 billion in annual revenue across the United States. Industry data shows that revenue increased by 0.5% in 2023, despite a broader trend of market size declining at 1.3% annually between 2018 and 2023. This resilience demonstrates the ongoing demand for professional repair services even as new appliance prices continue rising.
What makes these appliance repair statistics particularly interesting is the growth trajectory. The industry has maintained a Compound Annual Growth Rate (CAGR) of 0.8% between 2020 and 2025, indicating steady expansion despite economic fluctuations. This growth stems from multiple factors: consumers choosing repairs over replacements due to high new appliance costs, increasing complexity of modern appliances requiring specialized service, and a growing trend toward sustainability through extending appliance lifespans.
The service model has evolved significantly over the past decade. Modern appliance repair businesses operate differently than the neighborhood repair shops of previous generations. Today’s companies often employ multiple technicians, use sophisticated diagnostic software, and maintain comprehensive parts inventories to provide same-day service. This professionalization has helped standardize pricing while improving service quality across the industry.
Market Size and Revenue Trends
Current market research places the U.S. appliance repair industry at approximately $6.5 billion in total revenue. This figure represents money spent by homeowners and businesses on professional repair services, parts, and related service contracts. The market has shown remarkable stability, growing consistently despite economic pressures that typically reduce discretionary spending on home maintenance.
Industry analysts note that revenue growth of 0.5% in 2023 came during a period when many service industries faced contraction. This growth occurred even as the total market size experienced a slight decline of 1.3% annually between 2018 and 2023. The apparent contradiction between revenue growth and market size decline reflects industry consolidation—fewer but larger and more efficient companies capturing a greater share of the market.
Regional variations in market size correlate strongly with population density and housing stock age. Metropolitan areas with older housing stock generate higher repair demand, while newer developments typically see lower repair frequency in the first 5-7 years after construction. The Northeast and Midwest regions, with their older housing inventory, consistently show higher per-capita repair spending than Sun Belt states with newer construction.
Number of Businesses and Industry Growth
The appliance repair industry consists of approximately 37,769 businesses operating across the United States, according to the most recent industry analysis. This number has grown at a CAGR of 0.8% between 2020 and 2025, adding roughly 300-400 new businesses annually to the national total. The growth pattern reflects both new startups entering the market and existing businesses expanding to serve multiple locations.
Business models vary significantly across the industry. Approximately 60% of businesses are single-owner operations employing 1-3 technicians, while the remaining 40% include larger companies with multiple service trucks and broader geographic coverage. The industry has seen consolidation trends in recent years, with successful independent operators acquiring smaller competitors and regional chains emerging in major metropolitan markets.
Competition remains fierce in most markets, keeping service prices relatively competitive. The average appliance repair business generates approximately $172,000 in annual revenue, though this figure varies substantially by location, service specialization, and business model. Successful operators typically maintain 60-70% repeat customer rates, highlighting the importance of quality service and customer retention in this relationship-driven industry.
Average Appliance Repair Costs by Type
Repair costs vary significantly depending on appliance type, failure severity, parts availability, and your geographic location. Understanding these average costs helps you budget for potential repairs and make informed decisions about service calls. The following data represents national averages compiled from service records across thousands of repair companies.
Refrigerator repairs typically cost between $200 and $400, with compressor replacements—the most expensive common repair—ranging from $500 to $1,000 depending on the model and refrigerant type. Dishwasher repairs average $150-300, with electronic control board failures representing the higher end of that range. Washing machine repairs typically cost $175-350, with transmission replacements exceeding $500 in many cases.
Dryer repairs generally range from $150 to $300, though heating element replacements are often less expensive at $100-200. Electric range and oven repairs average $175-350, while gas appliances typically cost 15-25% more due to additional safety requirements and specialized parts. Microwave repairs, when feasible, usually cost $100-200, though many homeowners opt for replacement given the relatively low cost of new units.
Service call fees represent a significant portion of repair expenses for homeowners. Most companies charge $75-150 just for diagnosis, with this fee sometimes applied toward the total repair cost if you proceed with the service. Emergency service, weekend calls, and after-hours appointments typically command 25-50% premium pricing. These service call economics significantly impact the repair vs replace decision, particularly for lower-cost appliances.
Geographic variations affect repair pricing substantially. Major metropolitan areas typically see 20-30% higher labor rates than rural markets, though parts costs remain relatively consistent nationwide. Coastal regions with higher costs of living generally show higher service prices across all appliance categories. Understanding your local market rates helps you evaluate repair quotes and determine whether pricing falls within reasonable ranges for your area.
Most Common Appliance Failures and Breakdown Statistics
Understanding which appliances fail most frequently and what components cause problems helps you anticipate potential issues and make informed purchasing decisions. Industry data reveals clear patterns in failure rates across appliance categories, with some surprising insights about reliability and longevity.
Refrigerators top the list for most common repairs, with approximately 28% of units requiring service within the first five years of ownership. The most frequent failure points include compressors (accounting for roughly 35% of refrigerator repairs), ice makers (25%), and electronic control boards (20%). These statistics highlight the increasing complexity of modern refrigerators, with computerized controls and sophisticated ice-making systems introducing more potential failure points than simpler models of previous decades.
Washing machines rank second in repair frequency, with about 26% requiring service within five years. Front-loading models show higher failure rates than top-loaders, primarily due to door seal failures, drum bearing issues, and drain pump problems. The most common washing machine repairs include drain pump replacements (30% of repairs), belt replacements (25%), and control board failures (15%). Interestingly, transmission failures—once the most common washing machine repair—have become less frequent as manufacturers shifted to direct-drive systems.
Dishwashers require repairs at a rate of approximately 24% within five years, with drain pump failures leading the list at 35% of repairs. Control board issues account for another 25%, followed by water inlet valve problems at 15%. The increasing electronic complexity of modern dishwashers, with sensors and computerized controls, has contributed to rising repair rates compared to simpler mechanical models from previous generations.
Which Appliances Break Down the Most
When ranked by overall repair frequency, the order from highest to lowest is: refrigerators (28% five-year failure rate), washing machines (26%), dishwashers (24%), dryers (22%), electric ranges (20%), and gas ranges (18%). This ranking reflects both inherent reliability differences and usage patterns—appliances with more moving parts and longer daily run times naturally show higher failure rates.
Age-related failure patterns follow predictable curves across all appliance categories. The first 2-3 years show relatively low failure rates, with most issues covered by manufacturer warranties. Years 3-7 represent the peak repair period, when appliance repair statistics show 60-70% of all repairs occur. After 7-10 years, repair frequency either declines as owners replace failing units or increases significantly as multiple components reach end-of-life simultaneously.
Brand reliability variations significantly impact these statistics. Consumer Reports data consistently shows certain brands maintaining 15-20% lower failure rates than category averages. Premium brands sometimes show higher repair rates than mid-range options, largely due to greater complexity and more electronic components. These brand-specific variations represent one of the most valuable insights from appliance repair statistics for consumers making purchasing decisions.
Most Frequent Repair Types
Component failure patterns reveal important insights about appliance design and manufacturing quality. Electronic control board problems have become increasingly common across all appliance categories, now representing 20-25% of all repairs. This statistic reflects the trend toward computerized appliances with sophisticated user interfaces and automated features.
Mechanical failures remain common in appliances with moving parts. Washing machine drum bearings, dryer belts, and refrigerator compressor failures account for approximately 30% of all repairs. These mechanical failures typically follow predictable timelines based on usage patterns—appliances used more frequently or for larger loads tend to experience mechanical failures earlier than those with lighter usage.
Seal and gasket failures represent another significant repair category, particularly for dishwashers, washing machines, and refrigerators. These components deteriorate with age and exposure to detergents, water minerals, and temperature fluctuations. Door seal replacements account for 15-20% of dishwasher and washing machine repairs, while refrigerator gasket failures represent approximately 10% of refrigerator service calls.
Average Appliance Lifespan Statistics
Understanding expected appliance lifespans helps you plan for replacements and evaluate whether repairs represent good investments. Industry data shows clear patterns in longevity across appliance categories, with significant variations based on brand, usage patterns, and maintenance history.
Refrigerators typically last 10-15 years, with higher-end models often reaching the upper end of this range through better components and construction quality. Side-by-side models generally show slightly shorter lifespans than traditional top-freezer designs, largely due to more complex ice-making systems and greater mechanical complexity. Proper maintenance, including coil cleaning and gasket care, can extend refrigerator life by 2-3 years in many cases.
Dishwashers average 8-12 years of service life, with significant variation based on usage frequency and water quality. Models used daily typically fail 2-3 years earlier than those used 3-4 times per week. Water hardness significantly impacts dishwasher longevity, with mineral buildup affecting pumps, seals, and heating elements over time. Kitchen appliances exposed to hard water may show 20-25% shorter lifespans than those in areas with soft water.
Washing machines typically last 10-14 years, with front-loading models showing slightly shorter average lifespans than top-loaders. The high-spin speeds and complex door sealing systems of front-loaders contribute to more frequent repairs. Dryers generally outlast washing machines by 2-3 years, averaging 12-15 years of service life. Gas dryers typically show longer lifespans than electric models, largely due to simpler heating systems and fewer electronic components in many designs.
Ranges and ovens average 13-16 years of service life, with gas models typically outlasting electric units by 2-3 years. The simplicity of gas ignition systems compared to electric heating elements contributes to this difference. However, electric smooth-top ranges often fail earlier than coil-top designs due to glass cooktop susceptibility to damage from dropped objects and thermal stress.
Microwave ovens show the shortest average lifespan at 7-10 years, with built-in models typically lasting longer than countertop units. The high power output and heat generation in microwave ovens stress components significantly, particularly magnetron tubes and door seals. Given relatively low replacement costs, microwaves are often replaced rather than repaired when failures occur beyond the warranty period.
Appliance Repair Employment and Business Statistics
The appliance repair industry provides employment for approximately 45,000-50,000 technicians across the United States, working for the 37,769 businesses identified in industry census data. These professionals typically earn between $37,660 and $59,240 annually according to Bureau of Labor Statistics data, with hourly wages ranging from $18.11 to $28.48 depending on experience, specialization, and geographic location.
Industry employment has grown steadily alongside business expansion, adding approximately 300-400 new technician positions annually. This growth rate matches the overall industry CAGR of 0.8%, indicating healthy job prospects for qualified technicians. The aging workforce represents a significant industry concern, with approximately 40% of current technicians expected to retire within the next decade, creating substantial opportunities for new entrants to the field.
Technician productivity varies significantly based on service model and market conditions. The average service technician handles 4-6 calls per day, with first-call fix rates averaging approximately 50%. This means half of all repairs require return visits for additional parts or follow-up work, impacting both technician productivity and customer satisfaction. The most productive technicians maintain first-call fix rates above 70% through extensive parts inventories and diagnostic experience.
Business profitability correlates strongly with technician utilization rates. Successful companies typically maintain 75-85% technician utilization, meaning technicians spend that percentage of their workday on billable service calls. The remaining time involves driving between appointments, parts procurement, and administrative tasks. This productivity reality explains why service call fees exist—they compensate for technician time regardless of whether repairs proceed, covering the significant non-billable portion of each service day.
Repair vs Replace: Making the Right Decision
The 50-50 rule represents the most widely cited guideline for repair vs replace decisions. This rule states that when repair costs equal 50% or more of replacement cost, replacement generally makes better financial sense. The logic derives from appliance repair statistics showing that appliances requiring major repairs typically experience additional failures within 2-3 years, making multiple expensive repairs likely.
Appliance age significantly impacts this calculation. For appliances under 5 years old, repairs often represent good investments even at higher cost percentages, since the appliance has significant remaining service life. For appliances over 10 years old, repairs approaching 40% of replacement cost often justify replacement, even below the 50% threshold, due to increased likelihood of additional failures.
Energy efficiency improvements factor significantly into replacement decisions. Modern appliances often consume 20-30% less energy than models from 10+ years ago. When energy savings of $50-100 annually are factored in, replacement becomes financially attractive earlier than the 50% rule would suggest, particularly for high-usage appliances like refrigerators that run continuously.
Technological advances also influence repair vs replace calculations. Modern appliances offer features unavailable in older models—smart connectivity, improved temperature management, and better efficiency—that may justify upgrading even when repairs are relatively inexpensive. Conversely, owners who prefer simpler, more repairable appliances may choose repairs to avoid increasingly complex modern designs that are harder to service.
Your personal circumstances ultimately determine the right choice. Households planning to move within 2-3 years often choose repairs to avoid major expenses, while those expecting to stay long-term may invest in replacements for improved reliability and efficiency. Financial constraints also play a role—when replacement isn’t feasible, well-chosen repairs can extend appliance life for years at reasonable cost.
FAQ
What is the 50-50 rule for appliances?
The 50-50 rule states that if the cost of repair equals 50% or more of the cost of a new appliance, you should replace it rather than repair it. This guideline helps homeowners make financially sound decisions when faced with expensive repairs, especially for appliances that are already several years into their typical lifespan.
Is there a demand for appliance repair?
Yes, appliance repair remains a strong $6.5 billion industry in the United States with over 37,769 businesses operating nationwide. The industry continues to grow at a CAGR of 0.8% as more homeowners choose to repair existing appliances rather than replace them due to rising costs of new appliances.
What appliance breaks down the most?
Refrigerators top the list for most common repairs, followed closely by washing machines and dishwashers. The most frequent failures include compressor issues in refrigerators, drain pump problems in dishwashers, and belt or motor failures in washing machines. Statistics show that approximately 25-30% of major appliances will require some type of repair within their first 5 years of operation.
What are common appliance repair issues?
The most common appliance repair issues include compressor failure and refrigerant leaks in refrigerators, drain pump and valve failures in dishwashers, belt and motor problems in washing machines, heating element failures in dryers, and control board malfunctions across all modern appliance types. These issues account for over 60% of all service calls.
Conclusion
Appliance repair statistics reveal a robust $6.5 billion industry serving millions of households annually through 37,769 specialized businesses nationwide. Understanding these industry trends, average repair costs, and common failure patterns empowers you to make informed decisions about maintaining and repairing your household appliances. Whether facing an immediate repair decision or planning future purchases, data-driven insights help you allocate your home maintenance budget effectively.
Key takeaways include the importance of considering appliance age when evaluating repairs, the value of researching brand reliability before purchasing, and the wisdom of comparing repair costs against both replacement price and expected remaining lifespan. When appliances fail, these statistics help you determine whether repairs represent wise investments or money better applied toward replacements.
As appliance technology continues evolving with increasing electronic complexity and smart features, repair patterns will likely shift toward more control board and software-related issues. However, the fundamental economics of repair vs replace decisions will remain grounded in the principles outlined here. Use these statistics as guidelines, but always consider your specific circumstances, budget, and long-term plans when making appliance maintenance decisions.


Leave a Comment