
Reading HVAC gauges correctly is one of the most critical skills for any technician working with refrigeration systems. I’ve spent years troubleshooting AC units, and I can tell you that understanding what those needles and digital numbers are telling you can mean the difference between a proper diagnosis and an expensive misdiagnosis.
In this guide, I’ll walk you through exactly how to read HVAC gauges, from the basics of manifold sets to interpreting pressure readings for common refrigerants. Whether you’re using analog dials or digital displays, the principles remain the same – and knowing how to apply them will make you a more effective technician.
What Are HVAC Gauges and Why Do They Matter?
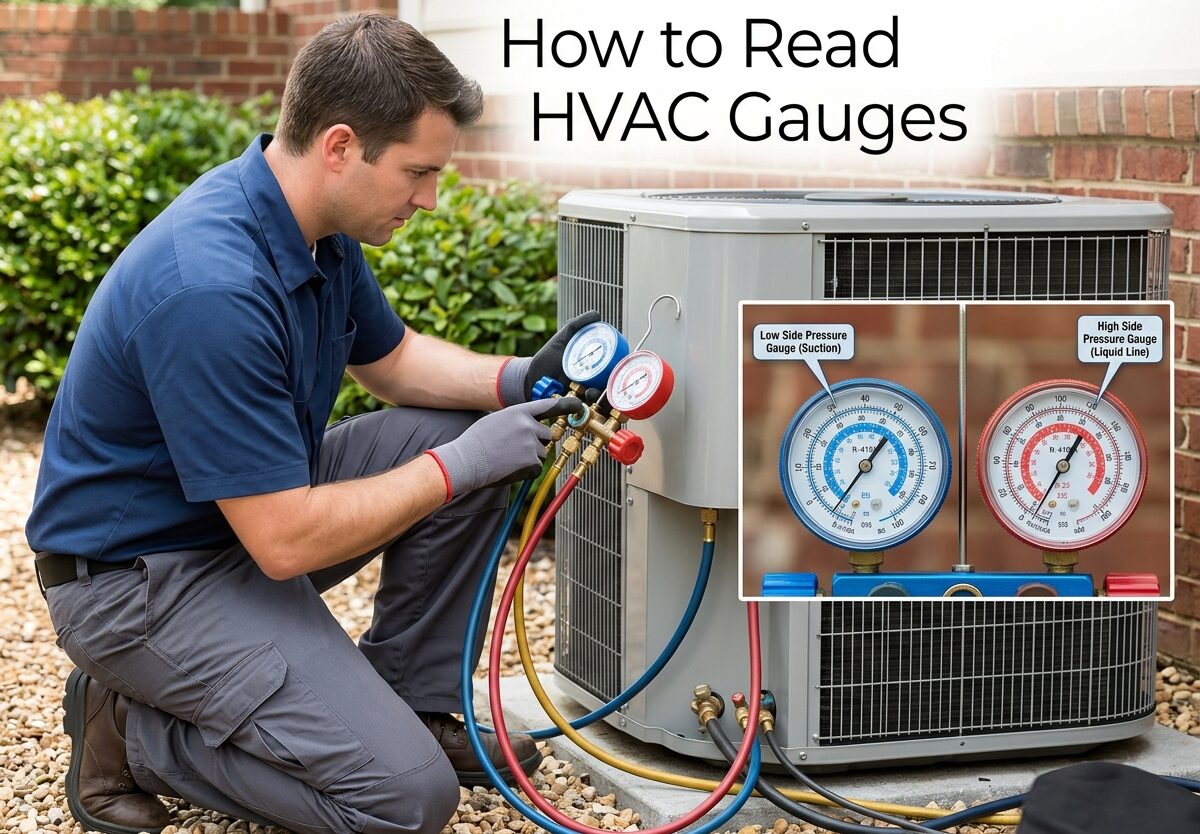
HVAC gauges, also called manifold gauge sets, are diagnostic tools that measure refrigerant pressure in air conditioning and refrigeration systems. They consist of a manifold body with two gauges – a blue low-pressure gauge for the suction side and a red high-pressure gauge for the discharge side – along with three connecting hoses and service valves.
Understanding gauge readings matters because they provide essential diagnostic information about system operation. When I connect my gauges to a system, I can quickly determine refrigerant charge levels, compressor efficiency, and identify problems like restrictions, leaks, or component failures. Proper gauge interpretation helps technicians diagnose issues accurately and determine if a system is operating within manufacturer specifications.
The gauges display pressure in PSIG (pounds per square inch gauge) and often include temperature scales for different refrigerants based on pressure-temperature relationships. This relationship between pressure and temperature is fundamental to refrigeration – knowing one tells you the other, assuming you’re working with a pure refrigerant in a saturated state.
Types of HVAC Gauges: Analog vs Digital
Analog HVAC gauges use traditional mechanical dials with needles that point to pressure readings on a printed face. These gauges have been the industry standard for decades and are favored by many experienced technicians who appreciate their reliability and lack of batteries. The main advantage is that you can see multiple refrigerant temperature scales printed directly on the dial face, making it easy to read saturation temperatures at a glance.
Digital manifold gauges have become increasingly popular in recent years, and for good reason. They provide precise numerical readings, often calculate superheat and subcooling automatically, and can store readings for later analysis. Many digital sets also feature Bluetooth connectivity that pairs with smartphone apps for data logging and report generation. I’ve found digital gauges particularly helpful when teaching new technicians, as there’s no ambiguity about which scale you’re reading.
The choice between analog and digital often comes down to personal preference and budget. Analog sets are more affordable and don’t require batteries, but digital sets offer features that can save time on the job. Many experienced technicians I know carry both – analog for quick checks and digital for detailed diagnostics and documentation.
Understanding Gauge Components and Color Coding
The color coding on HVAC gauges follows a consistent industry standard that you’ll find on every manifold set. The blue gauge connects to the low-side service port and measures suction pressure (typically 0-150 PSIG range). The red gauge connects to the high-side service port and measures discharge pressure (typically 0-500 PSIG range). The yellow hose and center port connect to your vacuum pump, refrigerant cylinder, or recovery machine.
The manifold body itself is the central component that houses the handwheels controlling flow through each hose. When you open a handwheel, you allow refrigerant to flow from the system through that hose. Close all handwheels before connecting or disconnecting to prevent refrigerant loss and system contamination. I always double-check that all valves are closed before making any connections – it’s a habit that’s saved me from releasing refrigerant more than once.
Your gauge hoses connect to Schrader valves on the service ports using special depressors that open the valve cores. The low-side (blue) hose connects to the larger suction line service port, while the high-side (red) hose connects to the smaller liquid line service port. Always connect to the proper port – reversing them can damage your gauges and give you meaningless readings.
How to Read HVAC Gauges: Step-by-Step Guide
Follow this procedure every time you connect your gauges to ensure accurate readings and prevent system contamination.
Step 1: Prepare the System
Before connecting gauges, verify the system is running and has been operating for at least 10-15 minutes to stabilize pressures. Check that you have the correct refrigerant type for the system – using the wrong gauge set or refrigerant can be dangerous and damage equipment. I once saw a technician try to use R410A gauges on an R22 system, which resulted in gauge damage due to the higher pressures involved.
Step 2: Connect the High-Side (Red) Hose
Locate the liquid line service port on the condenser – it’s the smaller copper line coming from the outdoor unit. Remove the service port cap and connect your red hose hand-tight. The high-side gauge will immediately show pressure if the system is running. Typical high-side pressures range from 200-400 PSIG depending on the refrigerant and operating conditions.
Step 3: Connect the Low-Side (Blue) Hose
Find the suction line service port on the larger copper line – usually near the evaporator coil or compressor. Remove the cap and connect your blue hose hand-tight. The low-side gauge will show suction pressure, typically ranging from 50-80 PSIG for most systems in normal operation.
Step 4: Purge Air From Hoses
Before opening the manifold valves, briefly crack each hose connection at the manifold to purge air from the lines. This prevents introducing air and moisture into the refrigerant system. I make it a habit to purge hoses every time, even if they were recently used – it only takes a second and prevents contamination that could cause system problems.
Step 5: Read and Record Your Measurements
With both hoses connected and purged, observe the gauge readings. The red (high-side) gauge shows discharge pressure from the compressor, while the blue (low-side) gauge shows suction pressure entering the compressor. Record both readings along with the ambient temperature and the type of refrigerant in the system. These three pieces of information are essential for proper diagnosis.
Step 6: Compare to Normal Operating Ranges
Use a pressure-temperature (PT) chart to compare your readings against expected values for the refrigerant type and current ambient conditions. Normal operating pressures vary significantly based on outdoor temperature – a system showing 225 PSIG on the high side at 75°F might read 300 PSIG at 95°F and still be operating normally. Always consider ambient conditions when evaluating gauge readings.
Reading Vacuum Measurements and Micron Levels
When evacuating a system before charging, your gauges measure vacuum in inches of mercury (inHg). Analog gauges show vacuum as negative pressure below zero, while digital gauges display it as positive vacuum. A proper evacuation should reach at least 500 microns, though many technicians aim for 250-300 microns to ensure complete moisture removal.
I’ve learned that analog gauges are notoriously inaccurate at deep vacuum levels. They might show 29 inHg while the system actually contains thousands of microns of moisture and air. For critical vacuum work, always use a dedicated digital micron gauge – the difference between a “good” evacuation and a “great” one can mean the difference between a long-lasting repair and a callback next summer.
When reading vacuum on analog gauges, remember that the scale works in reverse – higher vacuum (lower absolute pressure) reads as a larger negative number. 0 inHg is atmospheric pressure, while -29.92 inHg represents a perfect vacuum (though in practice, you’ll rarely achieve this with a mechanical pump).
Normal Operating Pressures for Common Refrigerants
Understanding normal pressure ranges for different refrigerants is essential for accurate diagnosis. These values assume a standard air conditioning application at approximately 80-85°F ambient temperature. Your readings will vary based on actual conditions, so always use a PT chart for precise evaluation.
R410A Pressure Readings: This high-pressure refrigerant typically shows 120-145 PSIG on the low side and 350-450 PSIG on the high side at normal operating conditions. R410A systems operate at significantly higher pressures than R22, which is why using the correct gauge set is critical. Never use R22-rated gauges on R410A systems – the higher pressures can cause gauge failure and potential injury.
R22 Gauge Readings: This legacy refrigerant (no longer produced in new equipment but still in many existing systems) typically reads 65-75 PSIG on the low side and 225-275 PSIG on the high side. If you’re servicing older equipment, these are the baseline ranges you should expect. Lower than normal readings usually indicate low refrigerant charge, while higher readings suggest overcharge or restricted airflow.
R134a AC Gauges: Commonly used in automotive applications and some commercial refrigeration, R134a typically shows 25-35 PSIG on the low side and 150-250 PSIG on the high side. Automotive systems often use different service port locations and may require adapters for standard gauge sets, so verify your equipment compatibility before connecting.
Understanding Superheat and Subcooling
Superheat measures the temperature increase of refrigerant vapor above its saturation temperature. I calculate superheat by measuring the suction line temperature with a clamp thermometer and comparing it to the saturation temperature corresponding to my low-side gauge reading. Normal superheat for a fixed orifice system typically ranges from 8-12°F, while TXV systems usually run 5-9°F.
Subcooling measures the temperature decrease of liquid refrigerant below its saturation temperature. I measure liquid line temperature and compare it to the saturation temperature from my high-side gauge reading. Normal subcooling typically ranges from 8-12°F for most systems. These two measurements tell me more about system charge and performance than pressure readings alone.
Digital gauges automatically calculate superheat and subcooling when you input temperature measurements, which saves time and reduces calculation errors. However, understanding the manual calculation process helps you verify your digital readings and troubleshoot when something doesn’t seem right. I’ve caught more than one bad temperature sensor by noticing that my calculated superheat didn’t match the gauge display.
Troubleshooting with Gauge Readings
Your gauge readings can reveal specific system problems when you understand what abnormal patterns indicate. I use these diagnostic scenarios regularly when troubleshooting systems.
Low Low-Side and Low High-Side Pressure: This pattern typically indicates low refrigerant charge. The system is starving for refrigerant, so both sides show reduced pressure. Before adding refrigerant, check for leaks using soap bubbles or an electronic leak detector. Simply adding refrigerant without finding and fixing the leak will result in another service call within weeks.
High Low-Side and High High-Side Pressure: Overcharged systems show this pattern, with both sides reading above normal. The excess refrigerant causes high head pressure while also flooding the evaporator and raising suction pressure. Recover some refrigerant and recheck readings. I always recover refrigerant slowly and monitor the changes – it’s easy to overcorrect and end up with an undercharged system.
Low Low-Side and High High-Side Pressure: This dangerous pattern indicates a restricted metering device or completely plugged filter drier. The restriction prevents refrigerant from flowing properly, causing high head pressure while the evaporator starves and suction pressure drops. This condition can cause compressor overheating and failure if not corrected immediately.
High Low-Side and Low High-Side Pressure: This pattern usually indicates a bad compressor with worn valves or reed valves that aren’t sealing properly. The compressor can’t build normal discharge pressure while suction pressure remains high because the inefficient compression can’t move refrigerant effectively. Unfortunately, this typically means compressor replacement.
Normal High-Side with Fluctuating Low-Side: If your high-side reading remains steady while the low-side needle bounces wildly, you may have a failing expansion valve or moisture in the system causing ice formation at the metering device. Check your superheat – if it varies widely, the TXV may be hunting or failing.
Heat Pump Mode: How Gauge Readings Change
Heat pumps present a unique challenge because the refrigerant flow reverses when the system switches from cooling to heating mode. The outdoor coil becomes the evaporator and the indoor coil becomes the condenser. This means your “high-side” and “low-side” readings effectively swap locations, which can be confusing if you’re not prepared for it.
In heating mode, the reversing valve redirects refrigerant flow so that the outdoor coil absorbs heat and the indoor coil releases heat. Your gauge hoses remain connected to the same physical ports, but the pressures you see will be dramatically different from cooling mode. I always verify the operating mode before connecting gauges to a heat pump – interpreting readings without knowing the mode leads to misdiagnosis.
Typical heat pump heating mode pressures might show 250-350 PSIG on what would normally be the low side (now the discharge line) and 150-200 PSIG on what would normally be the high side (now the suction line). These ranges vary based on outdoor temperature – colder weather reduces suction pressure because there’s less heat available for the outdoor coil to absorb.
When diagnosing heat pumps, I always check both modes if possible. Switching between cooling and heating while monitoring gauge readings can reveal reversing valve problems or other issues that aren’t apparent in a single mode. Just remember to allow sufficient time for pressures to stabilize after each mode change – at least 5-10 minutes of operation before taking readings.
Common Beginner Mistakes to Avoid
I’ve made most of these mistakes myself, and I’ve seen new technicians repeat them regularly. Learning from others’ errors can save you time, money, and embarrassment on the job.
Connecting Gauges While System Is Off: Always connect your gauges while the system is running. Connecting to a static system can cause refrigerant to rush into your hoses when you open the valves, potentially overfilling them and causing dangerous pressure buildup. I’ve seen technicians burst gauge hoses this way – it’s startling and potentially hazardous.
Reading the Wrong Scale on Analog Gauges: Analog gauge faces typically have multiple temperature scales for different refrigerants. It’s easy to read the R22 scale when you’re working with R410A, which will give you completely wrong temperature information. Always identify which scale corresponds to your refrigerant before taking readings. Most manufacturers color-code the scales or list refrigerant types directly on the dial face.
Ignoring Ambient Temperature: Pressures vary significantly with ambient conditions. A system operating at 95°F outdoor temperature will show much higher pressures than the same system at 75°F. I’ve seen technicians add refrigerant to a system that wasn’t low – it was just operating in hot weather. Always compare your readings to PT chart values adjusted for current conditions.
Not Purging Hoses Between Systems: Failing to purge air from your hoses can introduce moisture and non-condensables into the system you’re servicing. Even small amounts of air can cause high head pressure and reduced efficiency. I make purging a non-negotiable step – it takes two seconds and prevents problems that could haunt the system for years.
Over-Reliance on Gauges Alone: Sometimes I see technicians connect gauges before doing any visual inspection. Experienced pros know that gauges aren’t always necessary and can even lead you astray if you don’t understand system context. Check airflow, cleanliness, and obvious problems before connecting your manifold. Visual diagnosis often reveals the issue before you ever touch your gauges.
Seasonal Pressure Variations
Understanding how seasonal changes affect gauge readings is crucial for accurate diagnosis. I’ve seen countless technicians misdiagnose systems simply because they didn’t account for seasonal pressure variations.
During summer months with high ambient temperatures, both high-side and low-side pressures run higher. A system showing 400 PSIG head pressure at 95°F might be perfectly normal, while the same reading at 70°F would indicate a serious problem. Conversely, winter conditions produce lower pressures across the board. I always check the current outdoor temperature against the system’s design conditions before evaluating whether my readings are within acceptable range.
Heat pump seasonal variations are even more dramatic. In heating mode during cold weather, suction pressure drops significantly because there’s less heat available for the outdoor coil to absorb. I’ve seen heat pumps running 20-30 PSIG low-side pressure in freezing conditions – alarming if you don’t understand the context, but completely normal for the operating conditions.
Keep a seasonal pressure reference chart handy or use an app that adjusts expected ranges based on ambient temperature. Your diagnosis will be more accurate, and you’ll avoid unnecessary refrigerant additions or system condemnations based on readings that are actually normal for the conditions.
Safety and EPA Considerations
Working with refrigerant requires proper certification and adherence to safety protocols. EPA Section 608 certification is mandatory for anyone handling refrigerants in the United States, and for good reason – improper handling can release ozone-depleting substances into the atmosphere and result in substantial fines.
Always wear safety glasses and gloves when connecting or disconnecting gauges. Pressurized refrigerant can cause frostbite on contact with skin, and a sudden hose rupture can release refrigerant into your eyes. I’ve had refrigerant spray in my face more than once – protection isn’t optional, it’s essential.
Use low-loss fittings and check valves on your manifold to minimize refrigerant release during connection and disconnection. The EPA allows de minimis releases during normal service procedures, but excessive venting violates Clean Air Act regulations and can result in fines up to $44,539 per day per violation. Proper equipment and technique aren’t just about following rules – they protect the environment and save you money.
Never mix refrigerant types in your gauge set. Cross-contamination can ruin your hoses and gauges, and mixing refrigerants in a system renders it unusable. I keep dedicated gauge sets for different refrigerant types and clearly label them to prevent mix-ups. When in doubt, purge your hoses thoroughly or replace them rather than risk contamination.
FAQs
How do you read HVAC gauges?
What should a 410a gauge reading be?
What are normal AC gauge readings?
How to read a 200 psi gauge?
What is the difference between high and low side gauges?
What do the colors mean on HVAC gauges?
Conclusion
Learning how to read HVAC gauges is a fundamental skill that separates parts-changers from real technicians. I’ve seen countless technicians misdiagnose systems simply because they didn’t understand what their gauges were telling them. The pressure readings on that manifold tell a story about system operation – if you know how to interpret it.
Start with the basics: understand color coding, learn normal pressure ranges for common refrigerants, and practice your connection procedure until it becomes second nature. Then add advanced concepts like superheat and subcooling calculations, seasonal variations, and heat pump operation. Each piece of knowledge builds on the last, until you can look at a set of gauges and immediately understand what’s happening inside that system.
The most important advice I can give is this: never stop learning. Every system is different, and experienced technicians are still learning new diagnostic techniques decades into their careers. Use your gauges as tools, not crutches – they’re part of your diagnostic toolkit, not the entire toolkit itself. Combine gauge readings with visual inspection, customer information, and your own experience to make accurate diagnoses and provide quality service.
Whether you’re just starting out or looking to sharpen your skills, understanding how to read HVAC gauges properly will make you a more effective technician. Take your time, double-check your readings, and don’t be afraid to ask questions when something doesn’t make sense. The systems will tell you what’s wrong – you just need to learn the language they’re speaking.





Leave a Comment